LCB Notes
This page contains additional documentation relevant for the Stein Aerts Lab of Computation Biology (LCB).
VSC access
First you will need access to the VSC front nodes. For this, a VSC account is required plus additional ssh configuration.
Tip
Kindly ask Gert for assistance setting up your ssh configuration for the VSC using the
https://git.aertslab.org/connect_to_servers/ script.
Front nodes
We will work with following machines:
| Alias | HostName | CPU | Memory |
|---|---|---|---|
| hpc2-big1 | r10n1 | 10 core (20 threads) | 256 GB |
| hpc2-big2 | r10n2 | 10 core (20 threads) | 256 GB |
| hpc2-big3 | r6i0n5 | 2x 12-core (48 threads) | 512 GB |
| hpc2-big4 | r6i0n12 | 2x 12-core (48 threads) | 512 GB |
| hpc2-big5 | r6i0n13 | 2x 12-core (48 threads) | 512 GB |
| hpc2-big6 | r6i1n12 | 2x 12-core (48 threads) | 512 GB |
| hpc2-big7 | r6i1n13 | 2x 12-core (48 threads) | 512 GB |
The aliases are the ones defined by the https://git.aertslab.org/connect_to_servers/ script.
Running Arboreto on the front nodes
Following section describes the steps requires for inferring a GRN using Arboreto in distributed mode, using the front nodes.
Tip
Setting up a Dask.distributed cluster requires ssh access to multiple nodes. We recommend using a terminal multiplexer tool like tmux for managing multiple ssh sessions.
On the VSC, tmux is available by loading following module:
$ module load tmux/2.5-foss-2014a
We will set up a cluster using about half the CPU resources of the 5 larger nodes
(hpc2-big3 to hpc2-big7). One of the large nodes will also host the
Dask scheduler. One a smaller node, we run a Jupyter notebook server from which we
run the GRN inference using Arboreto.
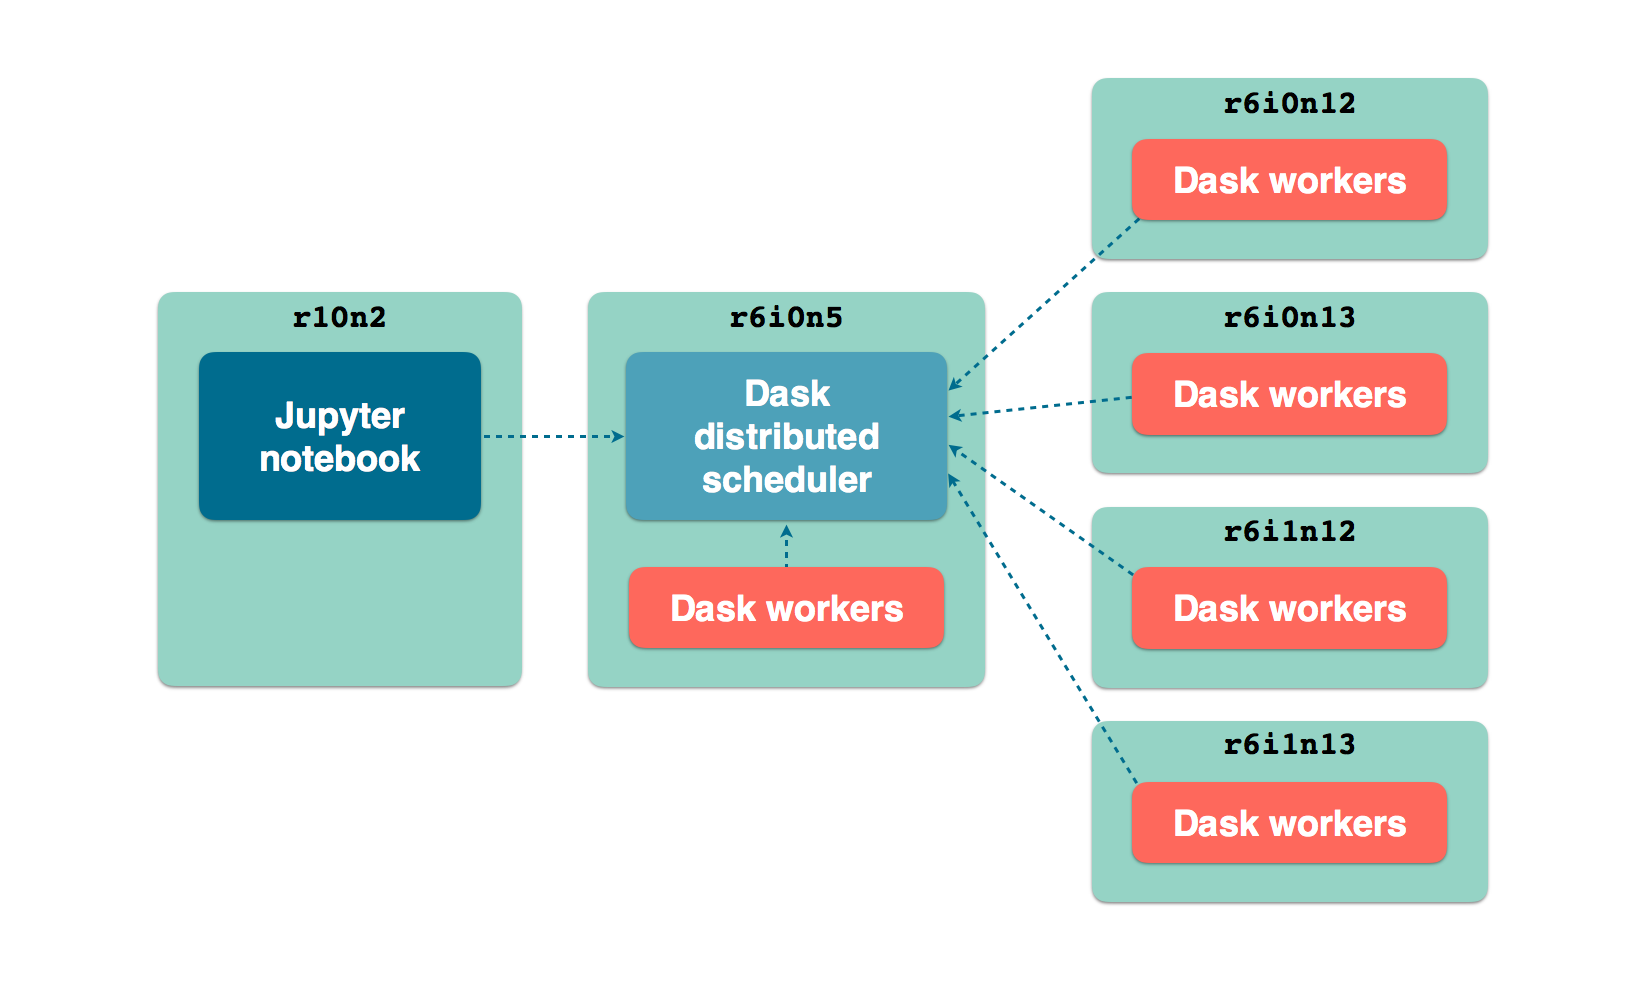
LCB front nodes distributed architecture
0. Software preparation
As recommended in the Installation Guide, we will use an Anaconda distribution. On the front nodes we do this by loading a module:
vsc12345@r6i0n5¶$ module load Anaconda/5-Python-3.6
We obviously need Arboreto (make sure you have the latest version):
vsc12345@r6i0n5¶$ pip install arboreto
$ pip show arboreto
Name: arboreto
Version: 0.1.5
Summary: Scalable gene regulatory network inference using tree-based ensemble regressors
Home-page: https://github.com/tmoerman/arboreto
Author: Thomas Moerman
Author-email: thomas.moerman@gmail.com
License: BSD 3-Clause License
Location: /vsc-hard-mounts/leuven-data/software/biomed/Anaconda/5-Python-3.6/lib/python3.6/site-packages
Requires: scikit-learn, dask, numpy, scipy, distributed, pandas
We now proceed with launching the Dask scheduler and workers. Make sure that on the nodes, the Anaconda module was loaded like explained above.
1. Starting the Dask scheduler
On node r6i0n5, we launch the Dask scheduler.
vsc12345@r6i0n5¶$ dask-scheduler
distributed.scheduler - INFO - ----------------------------------------------- │distributed.worker - INFO - Registered to: tcp://10.118.224.134:8786
distributed.scheduler - INFO - Scheduler at: tcp://10.118.224.134:8786 │distributed.worker - INFO - -------------------------------------------------
distributed.scheduler - INFO - bokeh at: :35874 │distributed.worker - INFO - Registered to: tcp://10.118.224.134:8786
distributed.scheduler - INFO - Local Directory: /tmp/scheduler-wu5odlrh │distributed.worker - INFO - -------------------------------------------------
distributed.scheduler - INFO - -----------------------------------------------
The command launches 2 services:
- The Dask scheduler on address:
tcp://10.118.224.134:8786 - The Dask diagnostics dashboard on address:
tcp://10.118.224.134:35874
Tip
The Dask diagnostics dashboard is useful for monitoring the progress of
long-running Dask jobs. In order to view the dashboard, which runs on the VSC
front node r6i0n5, use ssh port forwarding as follows:
ssh -L 8787:localhost:35874 hpc2-big3
You can now view the Dask dashboard on url: http://localhost:8787.
2. Adding workers to the scheduler
We will need the scheduler address: tcp://10.118.224.134:8786 (highlighted
above) when launching worker processes connected to the scheduler.
First, we launch 24 worker processes on the same machine where the scheduler is running:
vsc12345@r6i0n5¶$ nice -n 10 dask-worker tcp://10.118.224.134:8786 --nprocs 24 --nthreads 1
The command above consists of several parts, let’s briefly discuss them:
nice -n 10dask-worker tcp://10.118.224.134:8786 --nprocs 24 --nthreads 1Spins up 24 worker processes with 1 thread per process. For Arboreto, it is recommended to always set
--nthreads 1.In this case we have chosen 24 processes because we planned to use only half the CPU capacity of the front nodes.
In the terminal where the scheduler was launched, you should see messages indicating workers have been connected to the scheduler:
distributed.scheduler - INFO - Register tcp://10.118.224.134:43342
distributed.scheduler - INFO - Starting worker compute stream, tcp://10.118.224.134:43342
We now repeat the same command on the other compute nodes that will run Dask worker processes:
vsc12345@r6i0n12¶$ nice -n 10 dask-worker tcp://10.118.224.134:8786 --nprocs 24 --nthreads 1
vsc12345@r6i0n13¶$ nice -n 10 dask-worker tcp://10.118.224.134:8786 --nprocs 24 --nthreads 1
vsc12345@r6i1n12¶$ nice -n 10 dask-worker tcp://10.118.224.134:8786 --nprocs 24 --nthreads 1
vsc12345@r6i1n13¶$ nice -n 10 dask-worker tcp://10.118.224.134:8786 --nprocs 24 --nthreads 1
3. Running Arboreto from a Jupyter notebook
So far, we have a scheduler running with 5*24 worker processes connected to it and a diagnostics dashboard. Let’s now run a Jupyter notebook or Jupyter Lab server so that we can interact with the Dask cluster from within a Jupyter environment.
vsc12345@r10n2¶$ jupyter lab --port 9999 --no-browser
[I 12:16:08.725 LabApp] JupyterLab alpha preview extension loaded from /data/leuven/software/biomed/Anaconda/5-Python-3.6/lib/python3.6/site-packages/jupyterlab
JupyterLab v0.27.0
Known labextensions:
[I 12:16:08.739 LabApp] Running the core application with no additional extensions or settings
[I 12:16:08.766 LabApp] Serving notebooks from local directory: /ddn1/vol1/staging/leuven/stg_00002/lcb/tmoerman/nb
[I 12:16:08.766 LabApp] 0 active kernels
[I 12:16:08.766 LabApp] The Jupyter Notebook is running at:
[I 12:16:08.766 LabApp] http://localhost:9999/?token=2dca6ce946265895846795c4983191c9f76ba954f414efdf
[I 12:16:08.766 LabApp] Use Control-C to stop this server and shut down all kernels (twice to skip confirmation).
[C 12:16:08.767 LabApp]
Copy/paste this URL into your browser when you connect for the first time,
to login with a token:
http://localhost:9999/?token=2dca6ce946265895846795c4983191c9f76ba954f414efdf
Again, use ssh port forwarding to access the notebook server. Execute following command in a shell on your local machine:
localhost¶$ ssh -L 9999:localhost:9999 hpc2-big2
To access the notebook open a browser and navigate to following url:
http://localhost:9999/?token=2dca6ce946265895846795c4983191c9f76ba954f414efdf
Note
Using Jupyter is entirely optional. Everything explained in the following section is equally applicable to running Arboreto from a simple Python session or script.
As an example, please consider this script. Remember that the main code should be in a code block protected by:
if __name__ == '__main__':
    # ... code ...
Now we are ready to create a new notebook in Jupyter and write some Python code to check whether the cluster was set up correctly:
In [1]: from distributed import Client

In [2]: client = Client('tcp://10.118.224.134:8786')

In [3]: client

Out[3]:

    Client
    * Scheduler: tcp://10.118.224.134:8786
    * Dashboard: http://10.118.224.134:35874

    Cluster
    * Workers: 120
    * Cores: 120
    * Memory: 1354.63 GB
The cluster is set up and ready for Arboreto GRN inference work. Please review the section Running with a Dask distributed scheduler on how to use Arboreto in distributed mode.
To run in distributed mode, we need to make one modification to the code launching
the inference algorithm: specifying client_or_address in the (in this case) genie3 function:
network_df = genie3(expression_data=ex_matrix,
                    tf_names=tf_names,
                    client_or_address=client)
While our computation is running, we can consult the Dask diagnostics dashboard
to monitor progress. Point a browser to localhost:8787/status, you should see
a dynamic visualization like this:
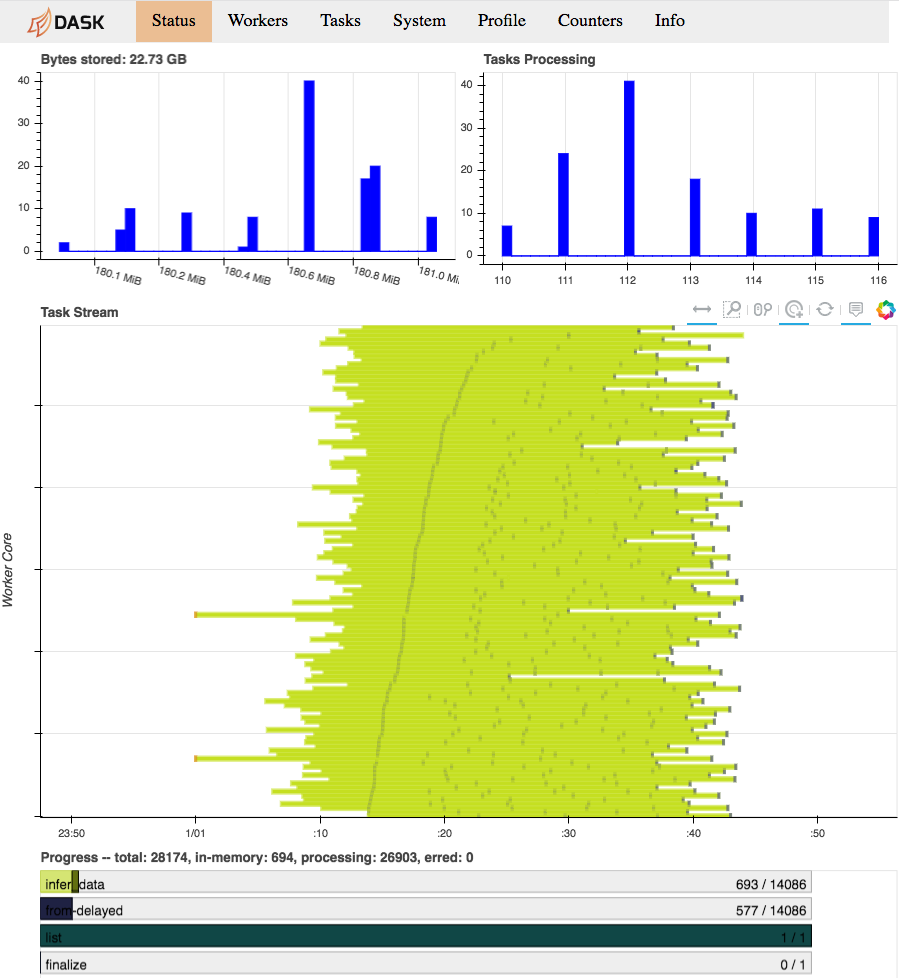
Dask diagnostics dashboard visualizing Arboreto progress
Note the progress gauges in the bottom:
infer_data–>693 / 14086means that 693 out of 14086 inference steps have been completed so far. As the inference steps entail almost the entire workload of the algorithm, this is a pretty accurate progress indicator.